Skip to main content
What chart displays and how many types of charts be available?
- Displays real-time price movements and historical trends with three different chart modes:
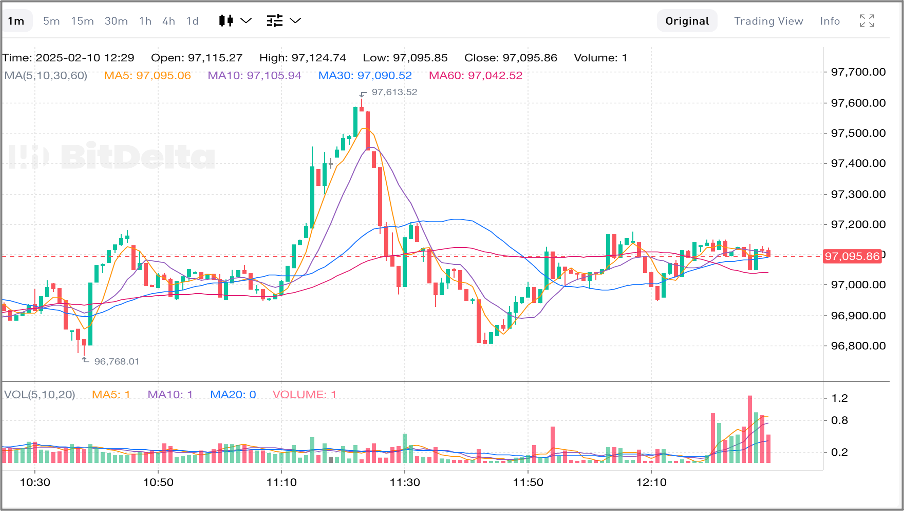
- Original Chart:
- Provides a basic price chart showing essential price movements.
- Ideal for traders who prefer a simple and clear view of market trends.
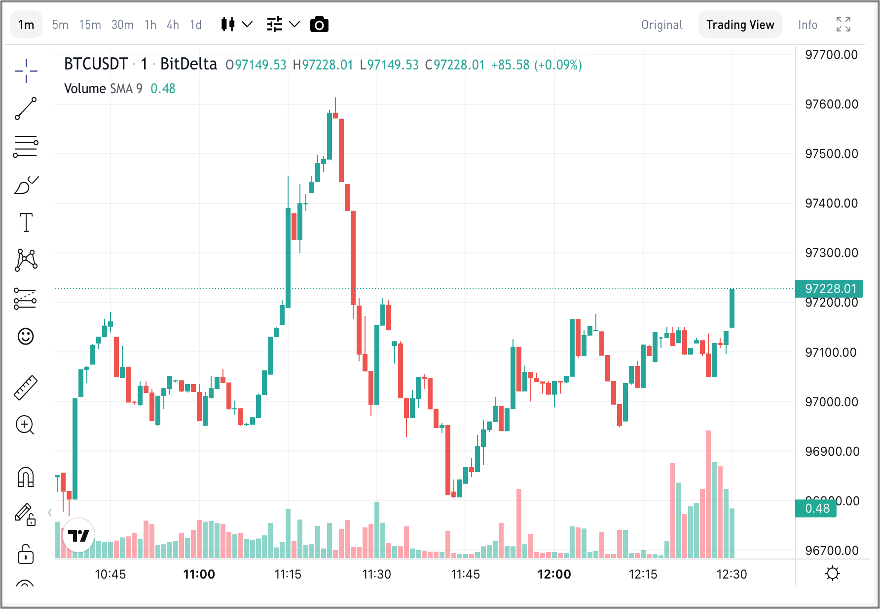
- TradingView Chart:
- A more advanced chart equipped with multiple drawing tools and indicators.
- Users can perform in-depth technical analysis using tools like Fibonacci retracements, trend lines, and different timeframes.
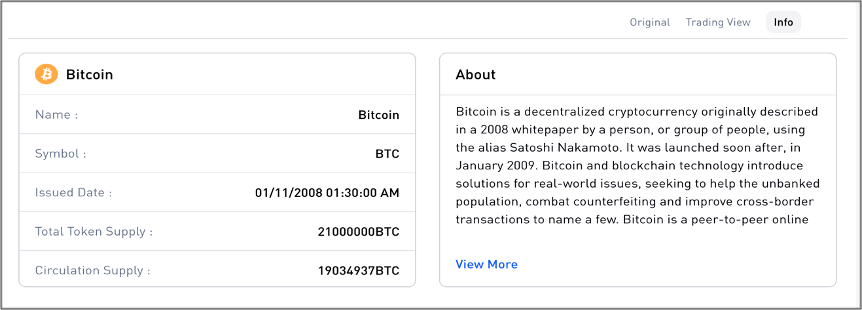
- Info Tab:
- Provides comprehensive details about the selected trading pair.
- Displays coin-specific information such as market cap, circulating supply, historical performance, and more.
- Timeframe Options: Users can choose from multiple timeframes (1m, 5m, 15m, 1h, 4h, 1d).
- Chart Customization: Different chart types (Hollow, Solid, Area, Bar) and technical indicators (EMA, RSI, Moving Averages).
- Indicators & Buy/Sell Options: Enables viewing to buy/sell pending orders and historical entry points.
Comments
0 comments
Please sign in to leave a comment.